Cybersecurity
October 17, 2026
Strengthen your DNS security with this guide to threats, DNSSEC, encryption, and enterprise defense best practices.
AWS anomaly detection helps teams spot unusual changes without setting a fixed limit for every metric or cost. CloudWatch learns normal patterns in application metrics, AWS Cost Anomaly Detection flags unexpected spending, and Amazon Lookout for Equipment analyzes industrial sensor data. Each serves a different need, but the goal is the same: find changes worth investigating sooner.
For security and IT leaders, an anomaly is a signal, not an explanation. The useful next step is to check its context, decide whether it affects operations or risk, and route it to the right team.
I'm Shahin Pirooz, a cloud and cybersecurity executive with more than 20 years of experience helping organizations build and manage cloud services. That background shapes this practical guide to aws anomaly detection and what teams should do with the signals it produces.
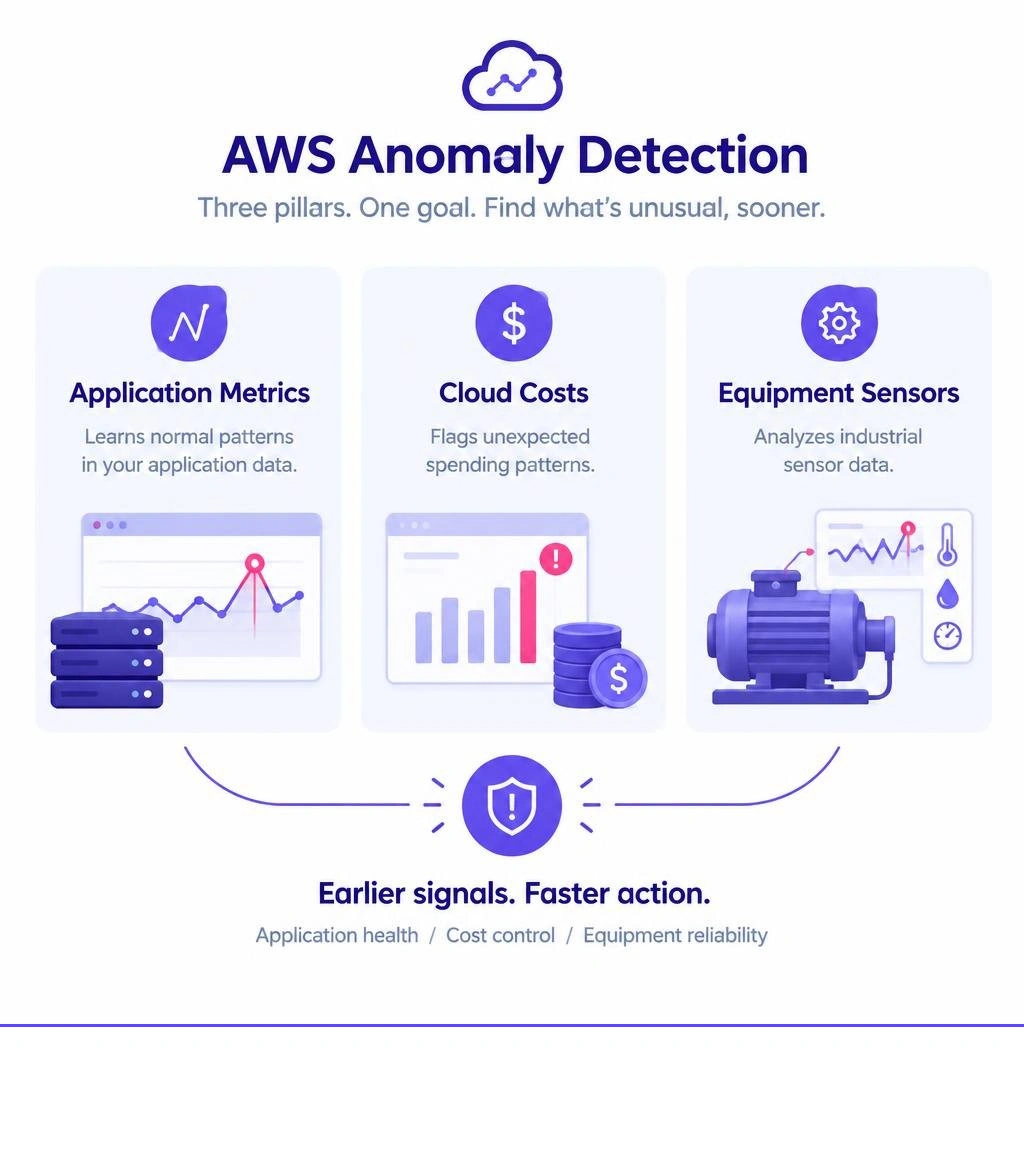
Modern enterprise cloud environments generate billions of events daily across infrastructure, billing APIs, and physical endpoints. Relying on static thresholds for telemetry causes two distinct operational problems: alert fatigue from overly sensitive triggers and silent outages from subtle degradations that stay under fixed limits. To build resilient systems, we need machine learning that adapts to operational telemetry, cost governance, and physical telemetry dynamically.
When designing cloud architectures in 2026, we categorize native anomaly detection into three distinct functional pillars:
| Capability Area | Core AWS Service | Primary Use Case | Underlying Model Behavior |
|---|---|---|---|
| Operational Telemetry | Amazon CloudWatch | Application performance, infrastructure metrics, gray failure detection | Statistical baselines and adaptive time-series ML models |
| Financial Governance | AWS Cost Anomaly Detection | Unplanned billing spikes, resource misconfigurations, shadow IT | Multi-dimensional cost attribution factoring in weekly spend trends |
| Industrial IoT | Amazon Lookout for Equipment | Asset telemetry, edge sensor streams, predictive maintenance | Multivariate sensor correlation modeling historical wear patterns |
To protect modern workloads across complex cloud environments, these automated detections must feed into an enterprise AWS security observability platform to correlate infrastructure spikes with real-time operational risk.
Amazon CloudWatch anomaly detection continuously evaluates operational metrics by applying statistical algorithms and machine learning to past performance. The service generates an expected band of behavior for any metric. You can enable this capability across standard AWS metrics (such as Amazon EC2 CPU utilization or Amazon S3 request counts) as well as custom business metrics.
When configuring CloudWatch detectors via the console or the PutAnomalyDetector API, the system models up to two weeks of historical data. The resulting model produces dynamic bands that capture hourly, daily, and weekly seasonality. If a system experiences heavy traffic every Tuesday morning and drops over the weekend, CloudWatch automatically thickens or adjusts the expected band, eliminating the need to update static thresholds manually.

CloudWatch supports metric math expressions, allowing engineers to apply anomaly detection to calculated values—such as error rate percentages or cache hit-to-miss ratios—using the ANOMALYDETECTIONBAND function. A real-world example of this value in action comes from the American Council of Education, where migrating away from static alarms to dynamic CloudWatch anomaly tracking helped control post-pandemic traffic spikes, cut false-positive alerts, and maintain clear operational visibility without overwhelming engineering teams.
Unexpected cloud bills are often the first sign of an underlying operational issue, such as a runaway auto-scaling loop, an unoptimized database query, or compromised credentials spinning up unmonitored compute resources. AWS Cost Anomaly Detection uses machine learning to identify anomalous spending and uncover root causes automatically.
Managed cost monitors track expenditures across member accounts, specific AWS services, cost allocation tags, or custom cost categories. Because spending naturally fluctuates around billing cycles and release cadences, the underlying model learns normal organizational patterns to suppress false alarms.
Once configured, cost monitors begin identifying deviations within 24 hours. Teams can define custom thresholds—such as alerting only when an anomaly's impact exceeds 1,000 dollars or shifts a service's daily run rate by more than 20 percent. You can manage these configurations manually in AWS Cost Explorer or automate deployment across environments by learning how to create Cost Anomaly Detection with Terraform, standardizing infrastructure as code (IaC) pipelines across hundreds of linked AWS accounts.
AWS extends automated anomaly detection into industrial and edge environments through AWS IoT SiteWise and Amazon Lookout for Equipment. Industrial operations generate high-frequency multivariate telemetry—tracking metrics like temperature, vibration, rotational velocity, and fluid pressure across physical machinery.
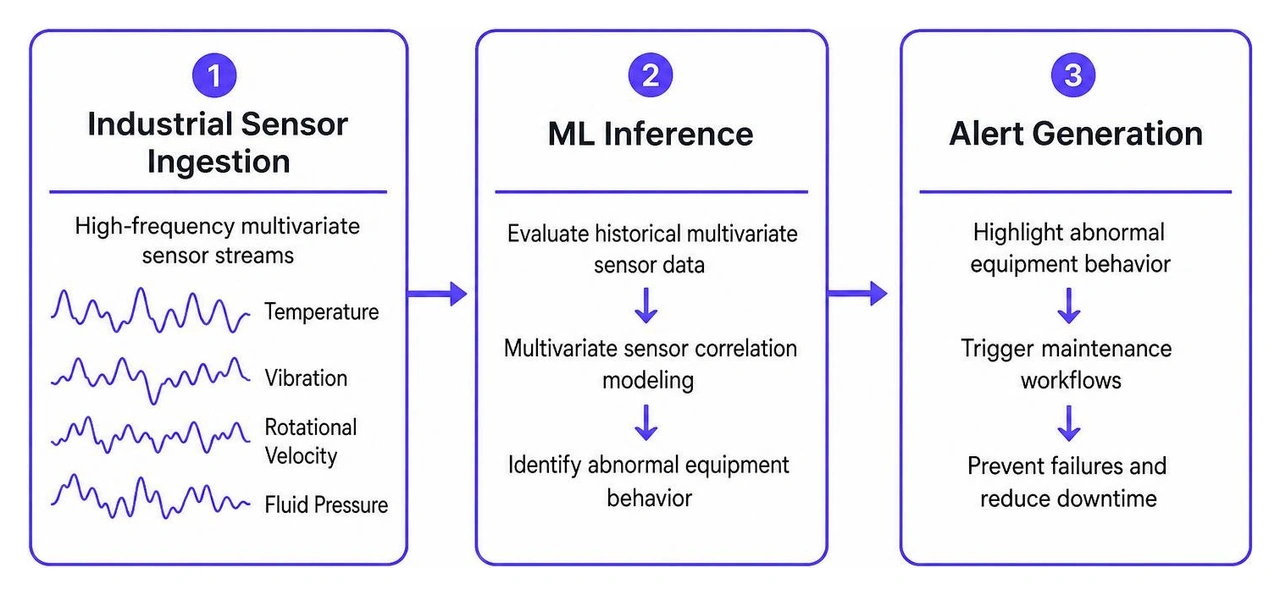
By following the Lookout for Equipment integration guide, operators define prediction configurations directly on IoT SiteWise asset models. The service evaluates historical multivariate sensor data, identifying subtle correlations that precede mechanical wear or component failure. Scheduled inference runs continuously against live ingestion streams, highlighting abnormal equipment behavior in SiteWise Monitor dashboards and triggering maintenance workflows well before physical failures disrupt operations.
Under the hood, AWS uses specialized algorithms designed for streaming and time-series data. A key algorithm across many of these services is Random Cut Forest (RCF), an unsupervised learning algorithm that calculates anomaly scores for multidimensional data points without requiring labeled training datasets.

Random Cut Forest works by constructing an ensemble of decision trees over streaming windows. Each tree is formed by randomly cutting dimensional bounds across input features. When a new data point arrives, the algorithm calculates how much the complexity of the forest increases by adding that point:
To capture temporal trends, AWS implementations apply a technique called shingling. Shingling groups consecutive observations (such as ten consecutive 1-minute CPU readings) into a single multidimensional vector. This allows the model to spot anomalies based on shape and velocity—such as an unnatural drop in traffic or a flatline—even if the individual values fall within historical minimum and maximum bounds. You can see this algorithm in action through the Random Cut Forest implementation notebook.
CloudWatch models refine these outputs further by bounding bands within real-world constraints. For instance, percentage metrics (like memory utilization) are automatically constrained between 0 and 100, while volume metrics (like network packets) never drop below zero, preventing unrealistic baselines.
High-throughput industrial systems and financial platforms often process tens of thousands of telemetry events per second. Running batch predictions against data lakes introduces too much latency for time-critical operational alerts.
To score streaming data in sub-seconds, teams combine Amazon Kinesis Data Streams with managed Apache Flink applications. In this architecture, raw JSON payloads stream directly from client applications or edge devices into Kinesis. The Flink application uses an embedded Random Cut Forest operator to process records in real time.
Anomalous events and their calculated scores sink directly to Amazon Timestream for fast dashboard rendering and to Amazon Kinesis Data Firehose for long-term Amazon S3 storage. A reference implementation of this pipeline is available in the Flink industrial anomaly detector repository, showing how organizations can process 100 or more messages per second per sensor group while streaming scores directly to operational dashboards.
Traditional system failures are straightforward: a server crashes, fails a health check, and gets removed from rotation. However, distributed architectures frequently suffer from gray failures—scenarios where an instance remains technically reachable but intermittently returns HTTP 5xx errors, drops database connections, or suffers severe latency spikes.

AWS Application Load Balancer (ALB) addresses this with automatic target weights (ATW). ALB evaluates HTTP, TCP, and TLS error ratios across backend targets every five seconds. If an individual target experiences a significantly higher error rate than its peers in the same target group, ALB flags it as anomalous and scales down its traffic weighting.
As detailed in the Application Load Balancer automatic target weights guide, this automatic mitigation can eliminate up to 96 percent of user-facing errors during partial backend failures without requiring manual intervention from on-call engineers.
Setting up effective anomaly detection requires connecting your detection rules to an automated notification and triage pipeline. Catching a data spike or sudden billing anomaly is only half the battle; your systems must route the finding to the right team with enough operational context to take action.
A comprehensive alerting pipeline includes three core components:
Organizations modernizing their monitoring can align these architectures with our comprehensive cloud security guide for 2026 and our structured threat detection guide.
Fine-tuning your models is essential to avoid alert fatigue. If an alert triggers every time a developer runs an ad-hoc query, teams will quickly mute the channel.
We recommend four best practices for tuning sensitivity:
When anomaly detection uncovers a high-severity issue, automation should handle initial triage and remediation. You can configure EventBridge rules to match specific CloudWatch and Cost Anomaly events and trigger targeted AWS Lambda functions or AWS Systems Manager automation runbooks.
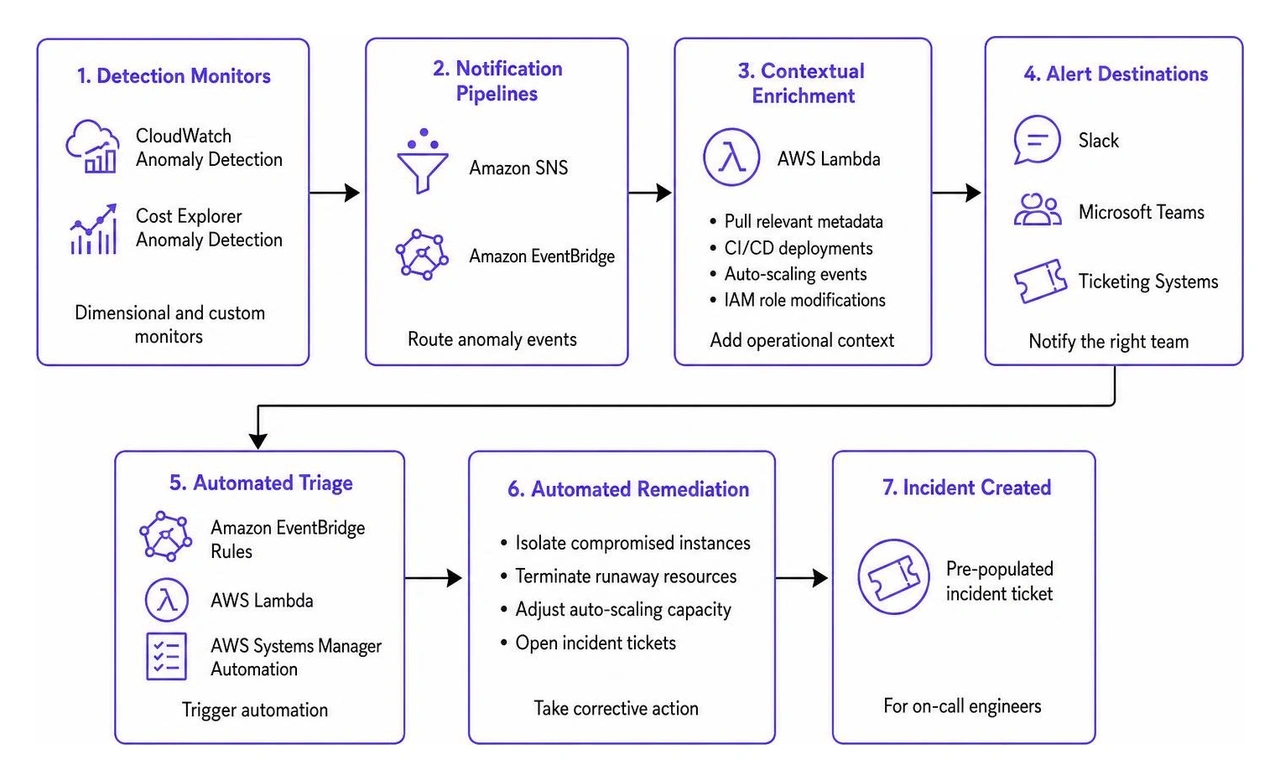
These automation steps can isolate compromised instances, terminate runaway non-production resources, adjust auto-scaling group capacities, or open pre-populated incident tickets for on-call engineers. Integrating automated triage into broader operational workflows helps teams scale their incident response solutions without creating administrative bottlenecks.
While native AWS anomaly detection tools are powerful, operating them across complex, multi-account enterprises introduces practical challenges that teams need to manage.
A common hurdle is the cold-start window. Machine learning models require sufficient historical data to establish reliable patterns. During the first two weeks of a new service launch, models may generate false positives or miss subtle anomalies while building their baselines. Teams should maintain sensible fallback alerts during early deployment phases.
A more significant operational challenge is signal fragmentation. An isolated anomaly—such as a sudden spike in S3 API calls or an unusual outbound data transfer pattern—might look like a standard workload surge to an infrastructure engineer. However, when correlated with a concurrent GuardDuty alert, a new IAM role creation, and an unusual geographic login, that same infrastructure anomaly signals data exfiltration.
Relying on disparate point tools across hundreds of AWS accounts leaves security teams sifting through isolated dashboards. Modern organizations solve this by uniting telemetry across cloud infrastructure, endpoints, identities, and network layers using AI-driven threat detection.
Pairing machine learning baselines with proactive incident response services ensures that statistical deviations are evaluated alongside security context, allowing teams to address genuine threats quickly while filtering out everyday operational noise.
CloudWatch anomaly detection trains on up to two weeks (14 days) of historical metric data to establish its initial baseline. However, you can enable anomaly detection on a metric immediately—even if it has less than two weeks of data. In those scenarios, the model establishes a preliminary baseline and continuously refines its expected band as new data points arrive.
The underlying machine learning model evaluates spending history across multiple time horizons, factoring in both daily operational variations and weekly business cycles. For example, if batch data processing regularly increases compute costs every Sunday night, the model learns this pattern as normal behavior and will not trigger an alert.
Static alarms compare incoming metric values against a fixed numeric threshold (such as alerting whenever CPU utilization exceeds 80 percent). Dynamic anomaly detection alarms use machine learning to calculate a moving band of expected values based on historical trends. Dynamic alarms trigger when a metric strays outside this band (above, below, or both), making them ideal for metrics with natural peaks, valleys, and seasonal cycles.
Detecting spikes, metric deviations, and financial anomalies is essential for maintaining efficient, reliable cloud operations. However, an anomaly detection model is ultimately a sensor: it flags that something changed, but human expertise and contextual data determine why it matters and how to respond.
At WhiteDog Cyber, we help organizations simplify their cybersecurity operations through a Unified Cybersecurity Platform that connects visibility, detection, response, and risk management. Rather than requiring a rip-and-replace approach, WhiteDog emphasizes modular integration that complements and extends your existing tools. By combining Open XDR telemetry with 24/7 SOC analysis, continuous attack surface management, and our top-tier Delta Detection & Response (DDR) service—with incident response integrated directly into MDR, XDR, and DDR rather than managed through separate retainers—we correlate signals across email, identity, endpoint, network, and cloud environments. This approach turns fragmented operational alerts into actionable intelligence, helping enterprise leaders eliminate alert fatigue, prioritize real risk, and protect their cloud operations with confidence.
Explore how to streamline and secure your cloud operations by reviewing our insights on AWS Security Hub integration and centralized security posture management.


Strengthen your DNS security with this guide to threats, DNSSEC, encryption, and enterprise defense best practices.

Learn how Cylance BlackBerry Protect uses AI-driven MTD to secure mobile endpoints, integrate with Microsoft Intune, and strengthen your SecOps.

Learn how an AWS security observability platform reduces alert fatigue, improves threat detection, and supports HIPAA compliance with proactive visibility.

Learn how to check DNS security across your infrastructure with a 5-step audit, including DNSSEC, email records, and CAA validation.

Master enterprise risk reduction with this detailed guide covering ERM frameworks, AI governance, and cybersecurity strategies for 2026.

Compare top AWS incident response solutions for rapid remediation, automated triage, and containment with native tools and expert escalation paths.